How To Calculate Solar Savings And Understand Your Payback Timeline

Most homeowners can analyze their solar savings using just a few basic numbers, and the average payback time period lies between 6 and 10 years; this range adjusts depending on your local electricity rate and availability of incentives, not to mention how well your system performs during different seasons.

It boils down to this: does the solar help you to save enough money to justify the money you put into them? A solid answer demands for one to know how savings factored into the equation, how net metering enables you to take excess electric credits to pay bills, why power generation data would indicate more electrical power is generated in July than in January- not to mention, what payback time intervals should be expected under realistic scenarios for real-life households. The article is about going through that.

What Determines Solar Savings on a Home?

The actual savings from solar does not really have to do with the panels themselves; it has everything to do with replacing the electricity they take. Instead of buying retail-rate electricity from the utility, your solar array produces another kilowatt-hour of electricity. The difference between what you made and what you would have paid will be the money in your pocket.

What Actually Moves the Numbers

What Drives Solar Savings

It is clear that the size of the system being installed is important. Every year, a 6 kW system in Phoenix will produce more than the same system in Seattle. This is because Arizona has more peak sun hours. The amount of peak sun hours in your vicinity every day dictates the amount of electricity your panels will generate over the course of a year.

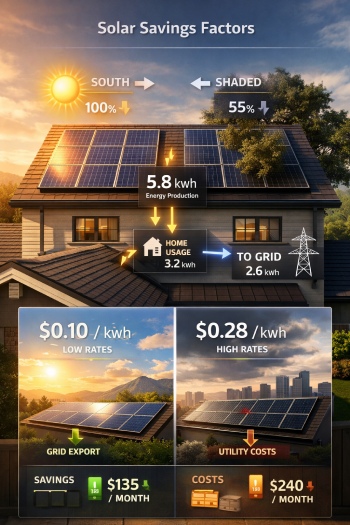
The roof orientation, shading and so forth have as much as effect on yielding. South-facing roofs without tree cover can systematically outproduce larger systems set northward on their shaded or east-west-facing roofs. A 10% shading loss might seem insignificant, but multiply it over 20 years and that is a huge loss.

The utility rates are what most people rarely think of as the multiplier. Homeowners each charged $0.28 per kWh in California save nearly double of what persons each charged $0.14 per kWh in the Midwest save for every solar unit produced. This, by and large, gives the savings because they shall be even greater in future, while rate inflation, historically about 2% to 4% annually, must be taken into account.

Incentives that are there can change the perception of it completely. The federal Investment Tax Credit shall cover the 30% installation costs. However, other state rebates, net metering policies, and SRECs could add thousands more due to your location terms.

Net metering is worthy of mention in its own right. In cases where your system produces more than your home can use, the excess goes back into the grid and you will be credited by utility firms. Without net metering, oversized systems would lose some of their significant financial benefits.

Consumption Patterns and Self-Use of Solar Energy

How and when you use electricity inside your home plays a quieter but equally important role in determining savings. Solar panels generate the most power during midday hours, but many households consume more electricity in the morning and evening. If a large share of your solar production is exported to the grid instead of used instantly, your savings depend heavily on how your utility compensates that excess energy.

Homes that align usage with production tend to capture more value. Running appliances like dishwashers, laundry machines, or EV chargers during daylight hours increases what’s known as self-consumption. In markets where export rates are lower than retail electricity prices, this difference becomes critical. Over time, even small adjustments in daily energy habits can noticeably improve the financial return of a solar system without changing the system size itself.

How Do You Calculate Solar Savings Step by Step?

Things get relatively manageable where math is concerned if you break them down into four chunks and numbers and me are nowhere near a well-flowered romance.

Estimate Annual System Production

The number of panels does indeed depend on the roof's size and makeup, for one, and the installation parameters. The output of a solar system varies based on the hour|hours the sun shines in a place during a day. In Phoenix Arizona, peak sun hours are around 5.5 hours a day, and an 8-kilowatt system generates roughly 16,000 kilowatt-hours annually. In Seattle, a similar-sized system with 3.5 peak sun hours would yield at least 10,000 kilowatt-hours. Most installers give yield estimates based on a specific address and roof pitch.

Compare Production With Household Usage

Pull your last 12 months of electricity bills and add up your total kWh consumed. The average U.S. household uses about 10,500 kWh annually. If your system produces 11,000 kWh and you use 10,500, you're essentially covering your full electricity needs, with a small surplus.

Apply Utility Rates and Credits

Here's the core formula: annual solar savings = (solar electricity used or credited) x utility rate. If your utility rate is $0.17 per kWh and your system offsets 10,500 kWh, that's $1,785 in savings. Excess energy sent back to the grid through net metering earns credits on your bill, often at or near the retail rate, which pushes annual savings higher.

Calculate Net Cost and Payback

The payback period is the net system costs divide by yearly savings. Let's consider typical cases. Sarah is a homeowner who installs the solar system at a total investment of $24,000. Claiming a 30% federal tax credit, she will reduce her net cost to $16,800. With an annual savings accounting for net metering credits totaling $1,900, Sarah will find out that by dividing $16,800 by $1,900, she will get a payback period of almost 8.8 years. Since most panels have 25-year warranties, anything longer than 17 years and she will be looking at essentially free electricity from that point onward.

Factor in Rate Increases Over Time

Electricity prices rarely stay flat. Most utilities raise rates gradually over the years due to infrastructure costs, fuel prices, and regulatory changes. When calculating long-term solar savings, it’s important to account for this upward trend. Even a modest annual increase of 2–3% can significantly boost your total savings over a 20–25 year system lifespan.

For example, if your current rate is $0.17 per kWh, that same electricity could cost closer to $0.25 or more within a couple of decades. Since your solar system continues producing power at a fixed cost, every rate increase widens the gap between what you would have paid and what you actually pay. This is why many long-term savings estimates end up higher than the initial yearly calculation suggests.

How Net Metering, Excess Energy Credits, And Seasonal Changes Affect the Numbers

Most homeowners think that they usually save as much as their solar panels produce. Well, it's much more complicated than their assumptions and starts with a policy known as net metering.

What Happens to Extra Solar Power

Some states offer full retail net metering, meaning your exported kilowatt-hour is credited at the same rate you'd pay to buy one. If electricity costs $0.15 per kWh, you get $0.15 back. That's the best-case scenario.

Other utilities use an avoided-cost or export rate, which can be as low as $0.03 to $0.06 per kWh. A homeowner in California under full retail net metering saves far more per exported unit than someone in a state with a flat export tariff. This gap matters enormously when you're calculating your actual annual savings, not just your system's raw output.

Why Summer and Winter Output Differ

A 7 kW system in Phoenix might produce 1,200 kWh in July but only 600 kWh in December. Shorter days, lower sun angles, and frequent cloud cover all reduce winter generation. That same household might use more electricity in summer for air conditioning, which conveniently aligns with peak production. Winter is where the math gets tighter.

How Billing Cycles and Credit Expiration Can Change Annual Savings

The credits don't necessarily roll forward indefinitely. Some utilities clear unused credits at the end of the year, at or near the beginning of the next fiscal year, which means that any excess production during the summer that was not consumed or credited before the reset date simply vanishes. So a reckoning homeowner banking on those credits to offset a high January heating bill might face a big surprise.

Always assess your solar savings over the full 12-month cycle. One bill for summer with near-zero charges looks encouraging but very unsure as a stand-alone benchmark.

How Self-Consumption Impacts Your Real Savings

Not all solar energy is valued equally. The electricity you use instantly inside your home, known as self-consumption, typically delivers the highest financial return because it offsets power you would otherwise buy at full retail rates. In contrast, exported energy is often credited at a lower rate, depending on your utility’s policy.

This means two homes with identical systems can see very different savings outcomes based purely on usage patterns. A household that runs appliances, cooling systems, or electric vehicle charging during daylight hours will use more of its own solar power directly. That reduces reliance on the grid at peak pricing and minimizes lower-value exports. In practical terms, aligning your energy use with solar production can quietly increase your total savings without changing anything about the system itself.

What Does a Realistic Solar Payback Timeline Look Like?

There were three homes, but three types of financial luck stories. Payback is generally a number of years during which cumulative net energy savings will exceed the original cost of the system. Return on investment refers to overall returns during the system's life, whereas net savings is the amount left over once the system has paid for itself. So, if anything, any system is paid off in 7 years but working for 25 years, for 18 of those years it will be producing electricity free of charge; meanwhile, that is where the real heap of cash lies!

Average Payback Example

James lives in Ohio, where electricity runs about $0.13 per kWh and net metering credits are slightly below retail. His 8 kW system costs $24,000, drops to $16,800 after the federal credit, and generates around 9,200 kWh per year. Effective annual savings come in near $1,100 once partial net metering credits are factored in. His payback period stretches to about 15 years. Still profitable over a 25-year lifespan, but the math requires patience.

Fast Payback Example

Take Maria in Massachusetts. She installs a 9 kW system for $27,000 before incentives. After the 30% federal tax credit, her net cost drops to $18,900. Massachusetts has strong net metering, meaning every excess kilowatt-hour she sends to the grid gets credited at the full retail rate of around $0.24. Her system produces roughly 10,800 kWh annually, saving her about $2,592 per year. Payback lands at just over 7 years. With a 25-year panel warranty, she's looking at roughly $46,000 in lifetime savings after the initial cost is recovered.

Solar Savings Are Real When the Math Works

The purpose behind these calculations is to consider the net system cost whereas many solar incentives and payments are made internal to the payback given equal weightage to annual (or lifetime) production expectations, utility policy on net metering, and seasonal variability in sunlight. Solar modules are not merely a cost; it's one of the many components to overall cost estimating.